XyloPlan Risk Assessment

Prepared for Grass Valley and Nevada City


Learn what XyloPlan can do for you.Book a demo

Demo Slides - built with publicly available data
© XyloPlan™ 2026

The formula for Fast Fires

Weather and Climate
  • Dry fuels
  • Sustained high winds
  • Low relative humidity
Wildfire
  • Wildland vegetation fuels that promote rapid fire spread
Transition
  • Unprepared homes
  • Outpace suppression
Urban Fire
  • Structure-Structure Spread
Fire Weather

Know your fire weather in Grass Valley and Nevada City.

We run an in-depth fire weather analysis to understand Fast Fires: when wind, humidity and fuel moisture line up to drive rapid fire spread.

Fewer than 3% of wildfires account for nearly 90% of the structures damaged or destroyed.

Fast Fires · Balch et al., Science, 2024
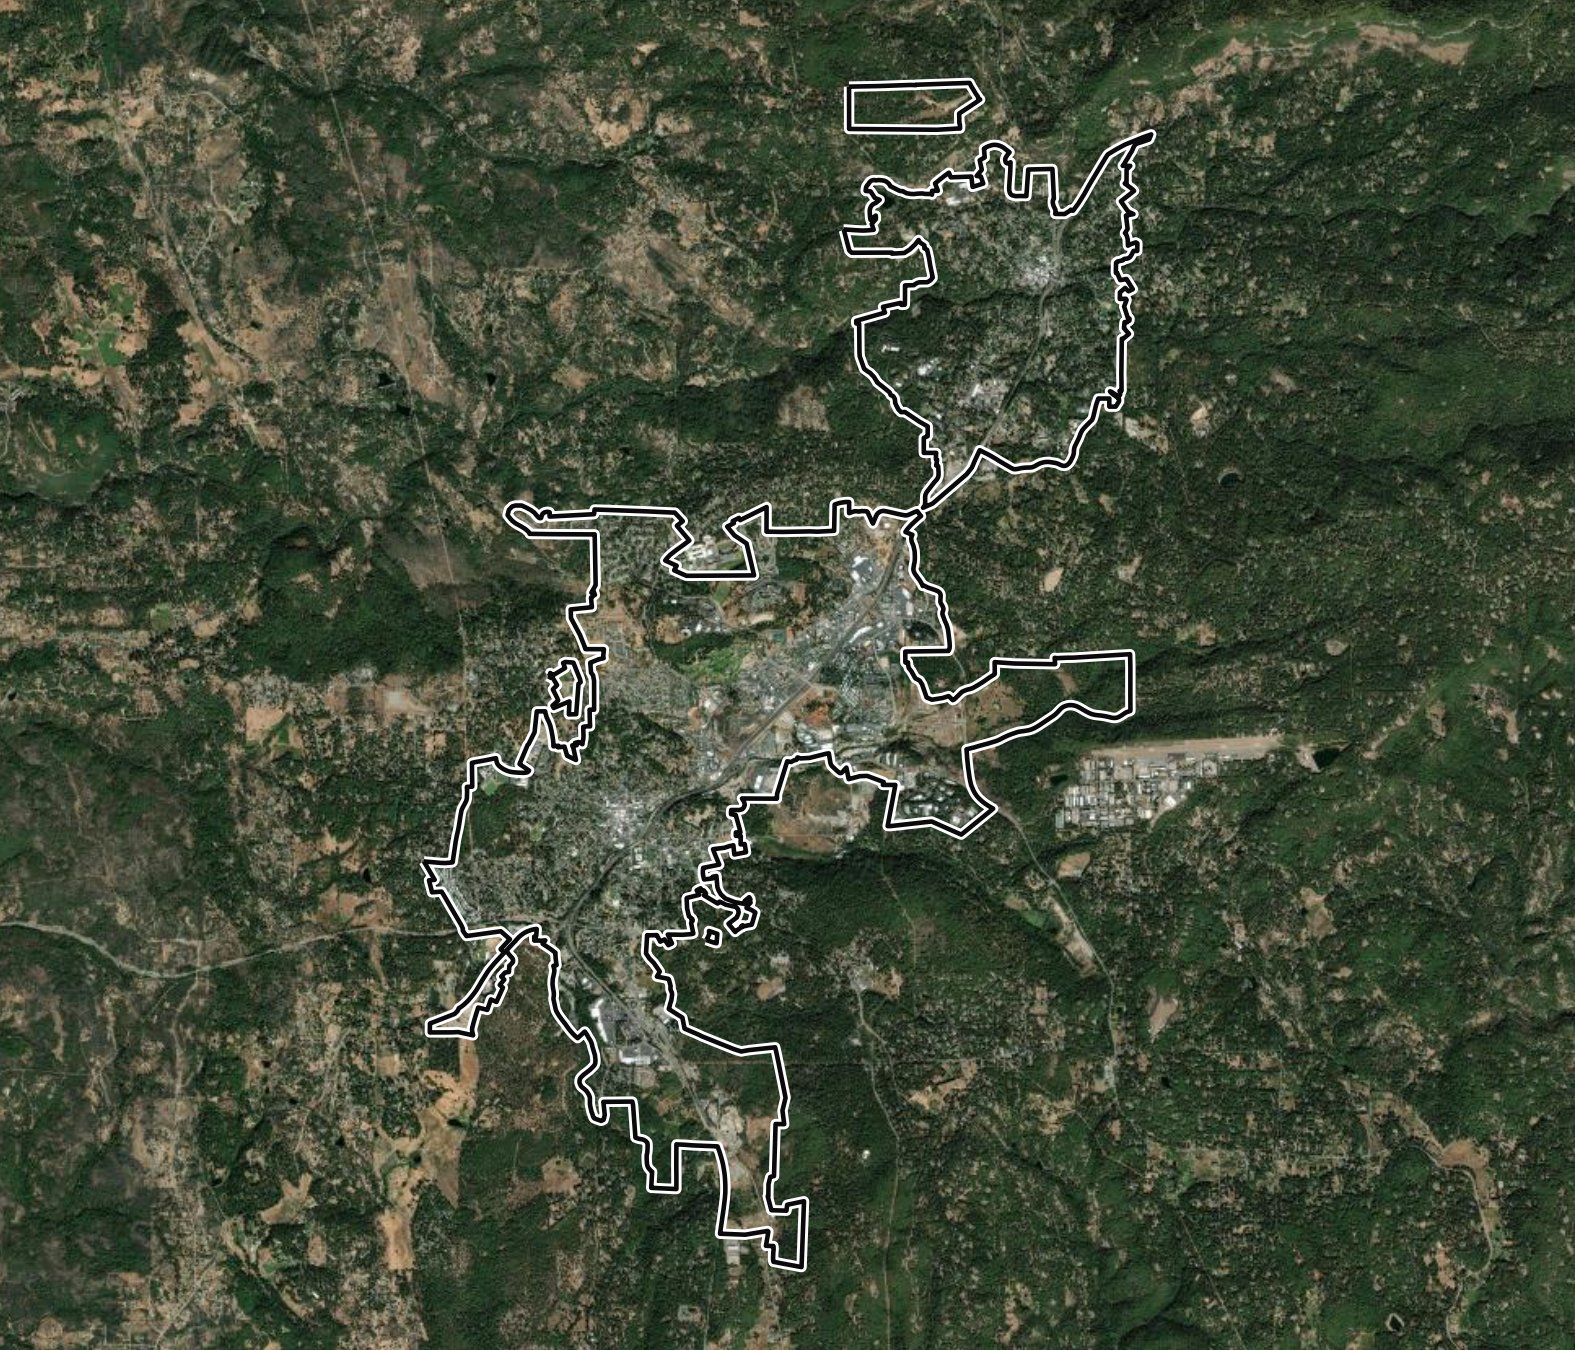
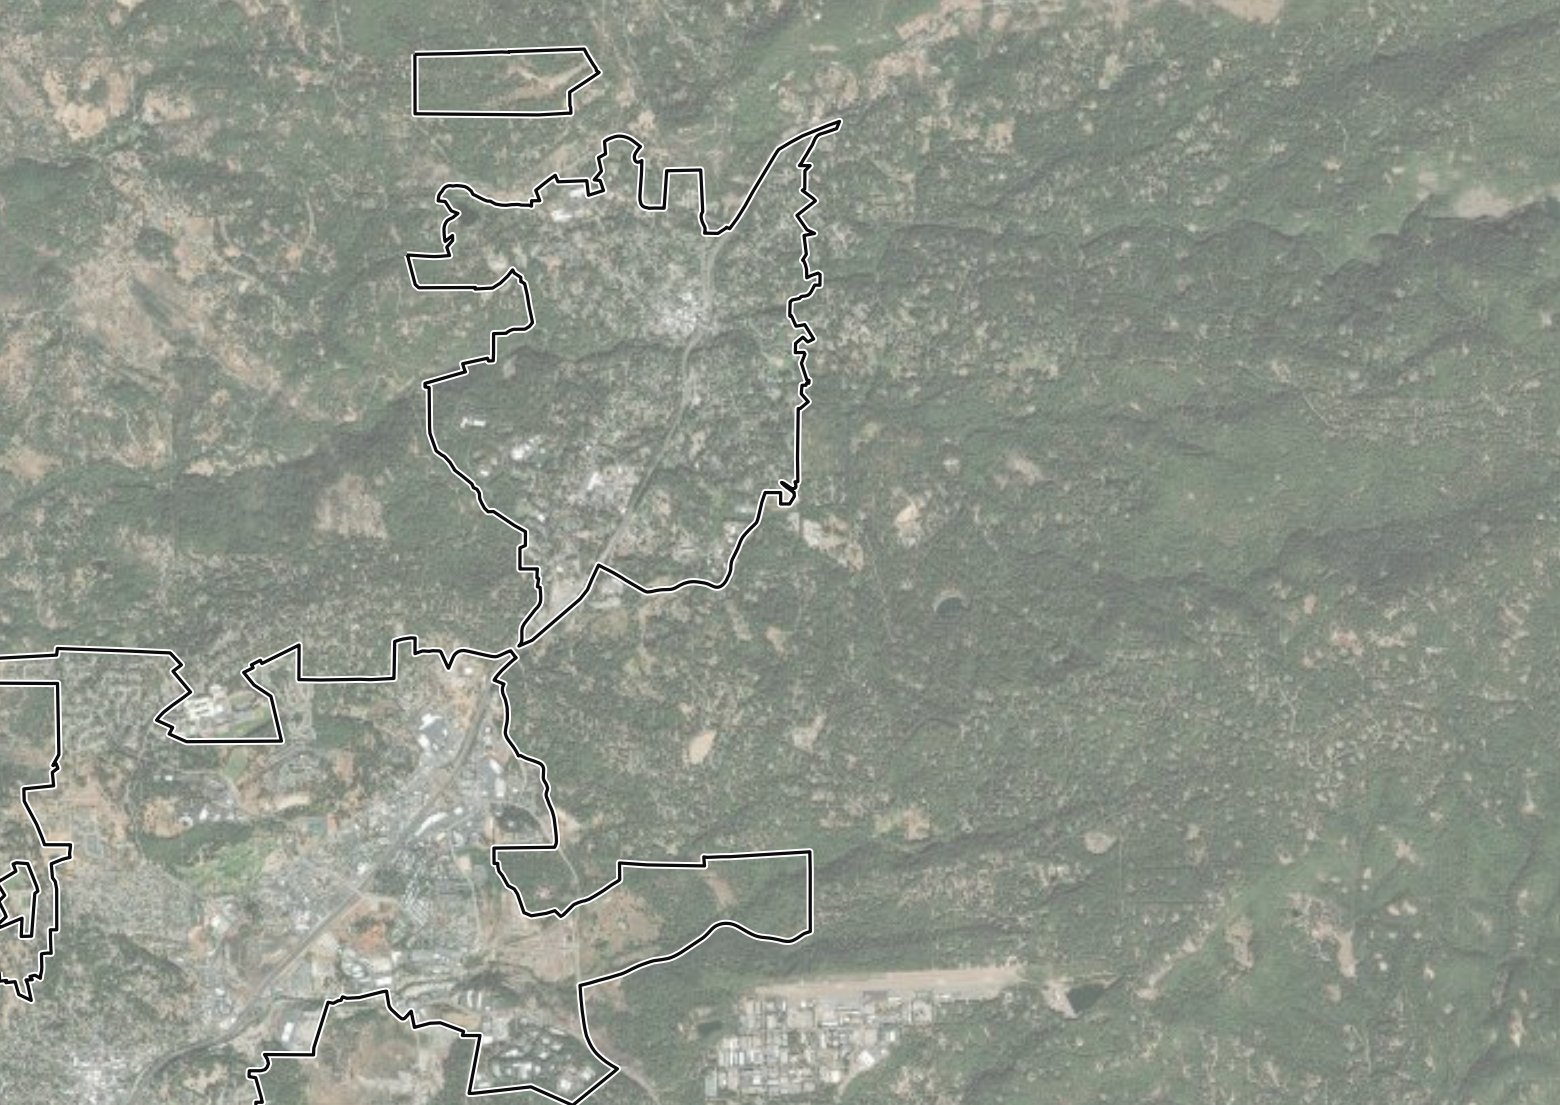
Satellite view of the study area
High Severity Wind Scenario
Historical event
DateOct 27, 2019
Wind29 mph, Northeast
Gusts76 mph
Humidity25%
Wind speed
SlowerFaster
Esri, Maxar, Earthstar Geographics, USDA FSA, USGS, Aerial Express, GeoEye, Getmapping, Aerogrid, IGN, IGP, swisstopo, and the GIS User Community

Fire weather events are increasing in Grass Valley and Nevada City.

05010015020025030019751980198519901995200020052010201520202025Fire weather events per year

The frequency of fire weather events is increasing over time.

Fire weather frequency varies by direction.

5%10%15%20%25%30%35%40%NNEESESSWWNW
Peak gust
Under 40 mph
40 to 45 mph
45 to 55 mph
Over 55 mph

Across 51 years, fire weather events in Grass Valley and Nevada City come mostly from the southwest, with a secondary mode from the northeast.

Fire Weather Event History

NNEESESSWWNW19751980198519901995200020052010201520202025Peak gustLowerModerateHigherEvent durationShorterLonger

Each circle is one wind direction in one year. Southwest, south and west winds drive most events, and northeast wind events last the longest.
Fire Spread Modeling

How one ignition unfolds.

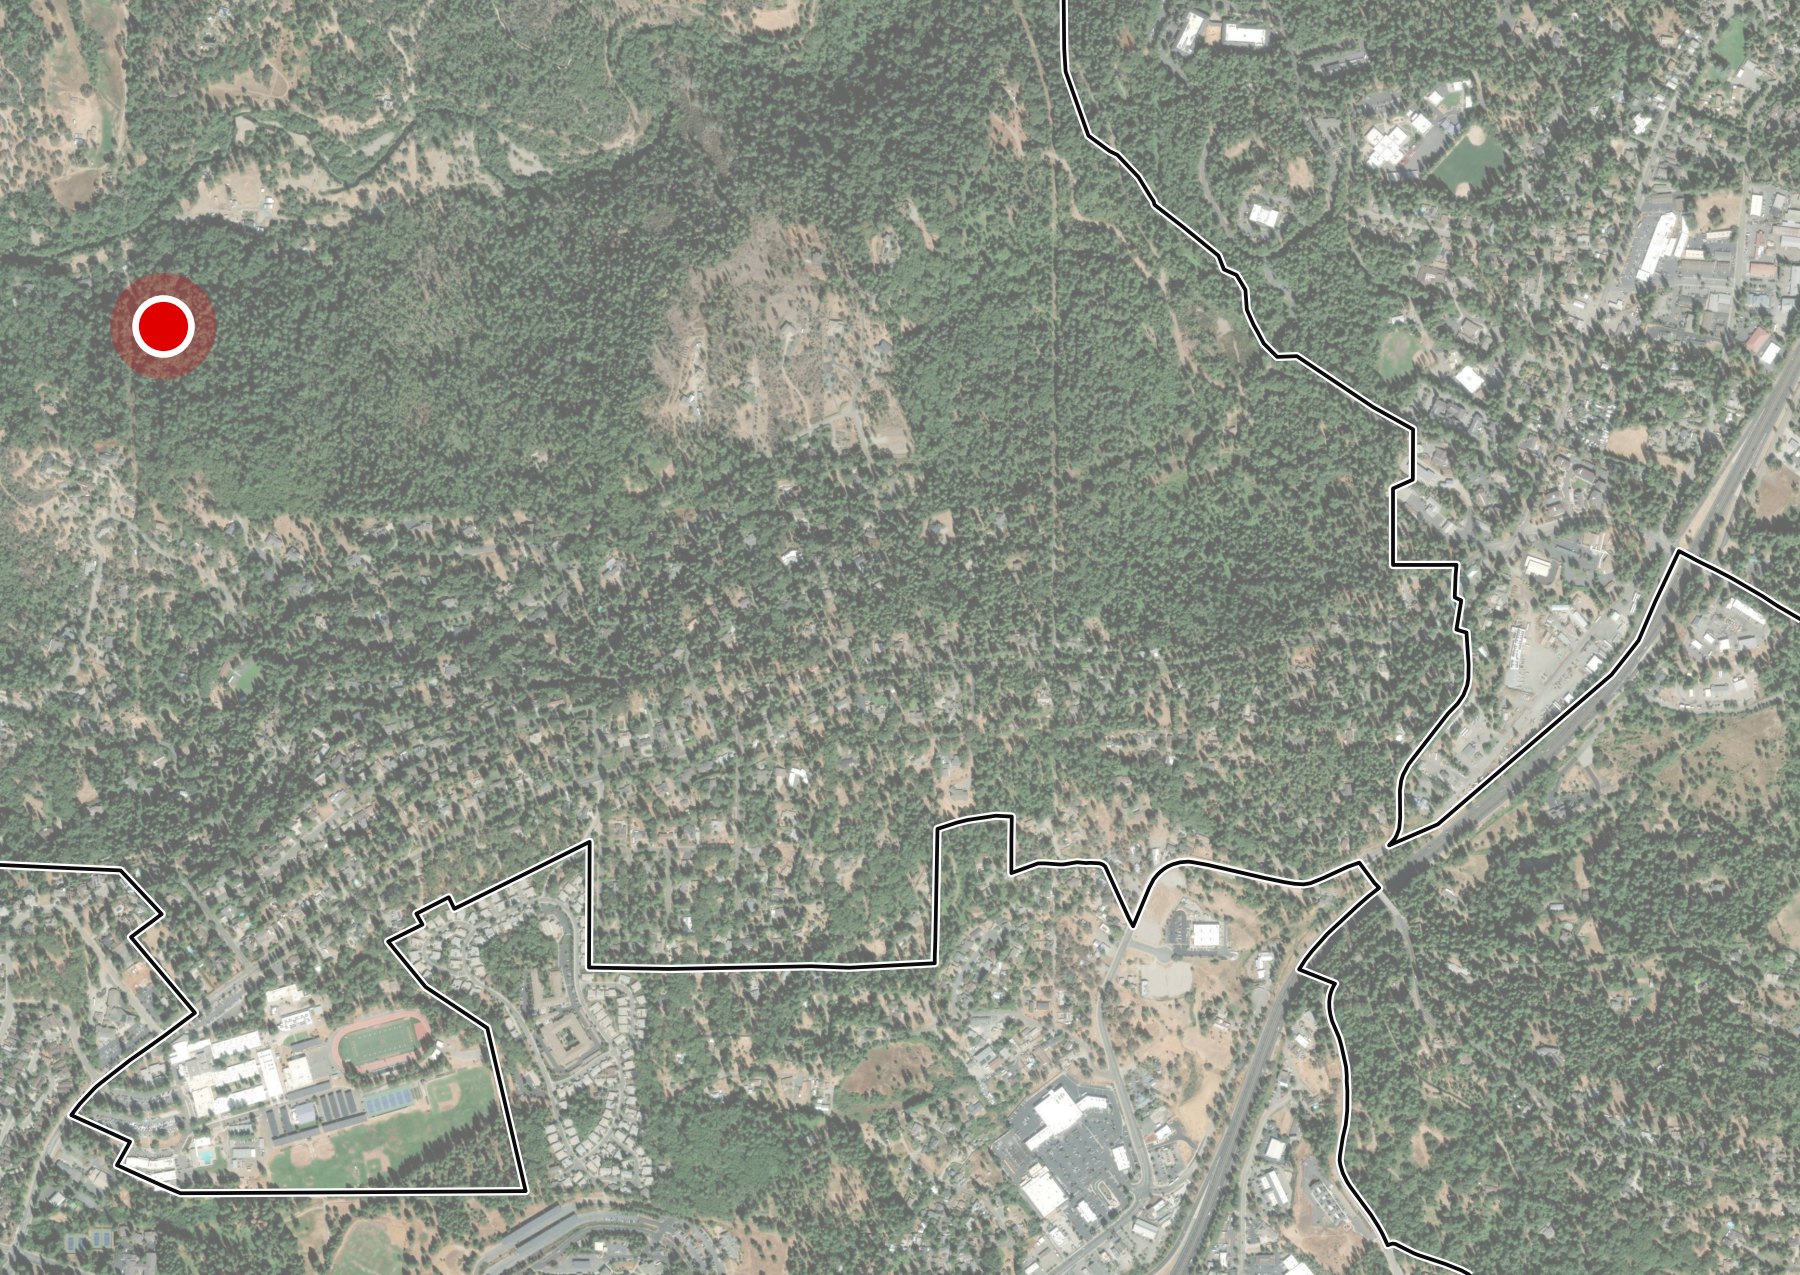
The XyloPlan Fire Model™ simulates urban fire spread across all wind directions. This example shows a single ignition with no mitigation and no suppression. Each structure is colored by how likely it is to ignite across many simulated runs.

Satellite basemap for the ignition probability progression Esri, Maxar, Earthstar Geographics, USDA FSA, USGS, Aerial Express, GeoEye, Getmapping, Aerogrid, IGN, IGP, swisstopo, and the GIS User Community
Structure Ignition Probability
Elapsed
0 h 00 m
Structure ignition probability
LowHigh
Ignition point
Structure, each dot is a home
Community boundary
Ignition mechanisms

A mechanism of ignition is how fire reaches a structure and what causes it to ignite. We simulate these mechanisms:

  • Surface fire: fire spreading through continuous ground fuels
  • Vegetation-to-structure: burning vegetation ignites a neighboring structure
  • Ambient spotting: embers carried ahead of the fire from burning vegetation ignite a structure
  • Structure spotting: embers from a burning structure ignite another structure
Scenario Modeling

Compare mitigation scenarios.

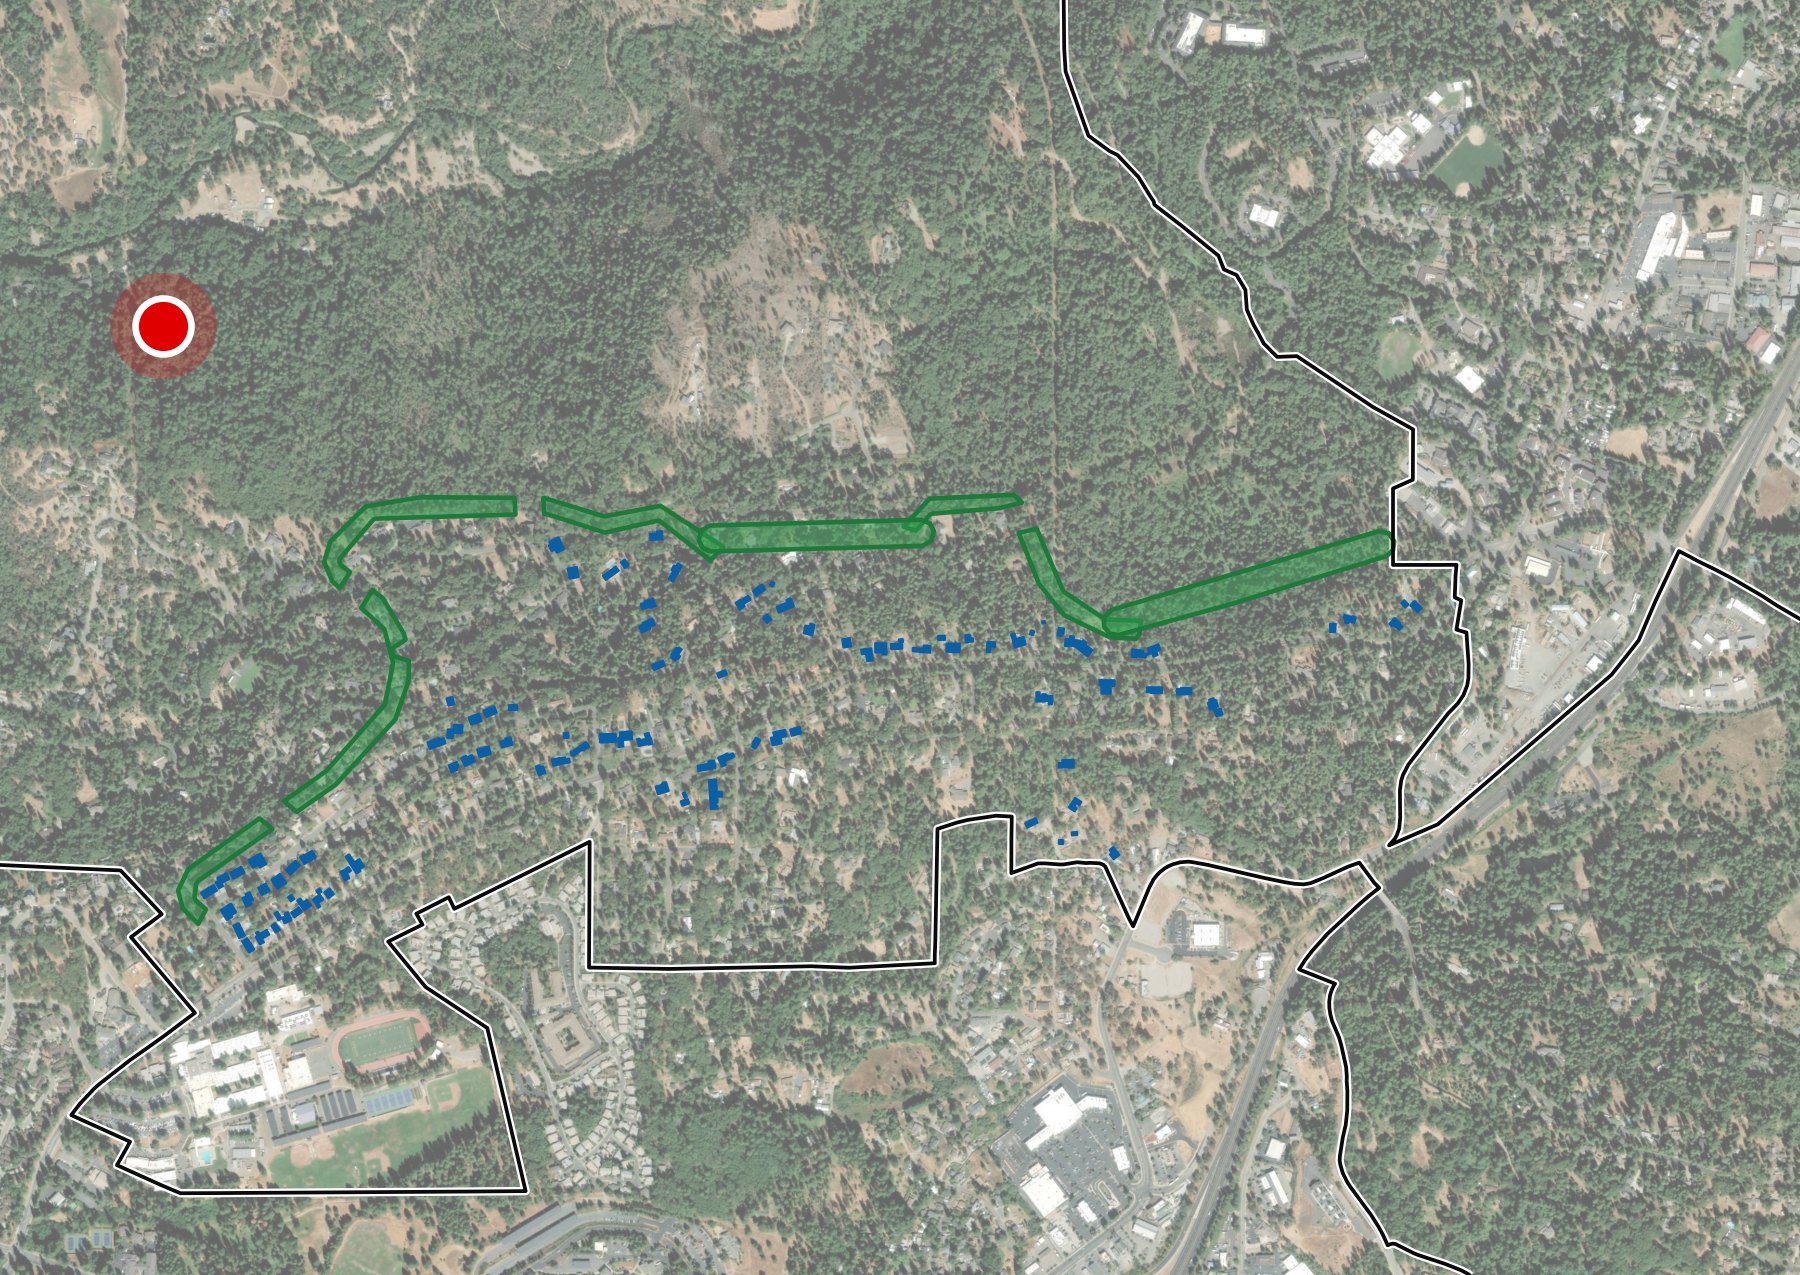
Illustrative example of one ignition with no suppression. Unmitigated shows the neighborhood as it is today, without home hardening or vegetation treatments in place. Mitigated hardens the outermost homes like a halo and adds vegetation treatment along the wildland edge, which slows the fire and protects the homes downstream. Each dot is a home, colored by how likely it is to ignite across many simulated runs, and the plot tracks structures ignited over time. Number of ignitions is the expected count of structure ignitions.

Unmitigated

No mitigation: simulated structure ignition probability Ignition point
No Mitigation
95Number of ignitions
Esri, Maxar, Earthstar Geographics, USDA FSA, USGS, Aerial Express, GeoEye, Getmapping, Aerogrid, IGN, IGP, swisstopo, and the GIS User Community

Mitigated

Mitigated: simulated structure ignition probability Ignition point
Hardened Homes and Vegetation Treatments
9Number of ignitions
Esri, Maxar, Earthstar Geographics, USDA FSA, USGS, Aerial Express, GeoEye, Getmapping, Aerogrid, IGN, IGP, swisstopo, and the GIS User Community
Structure ignition probability
LowHigh
Ignition point
Each dot is a home
Mitigation
Hardened homes
Vegetation treatments
Community boundary
Mitigation Plan

XyloPlan’s units for community mitigation planning.

Built on XyloPlan Fire Model™ results, we identify every conflagration block and work unit in your territory. These are units of mitigation.

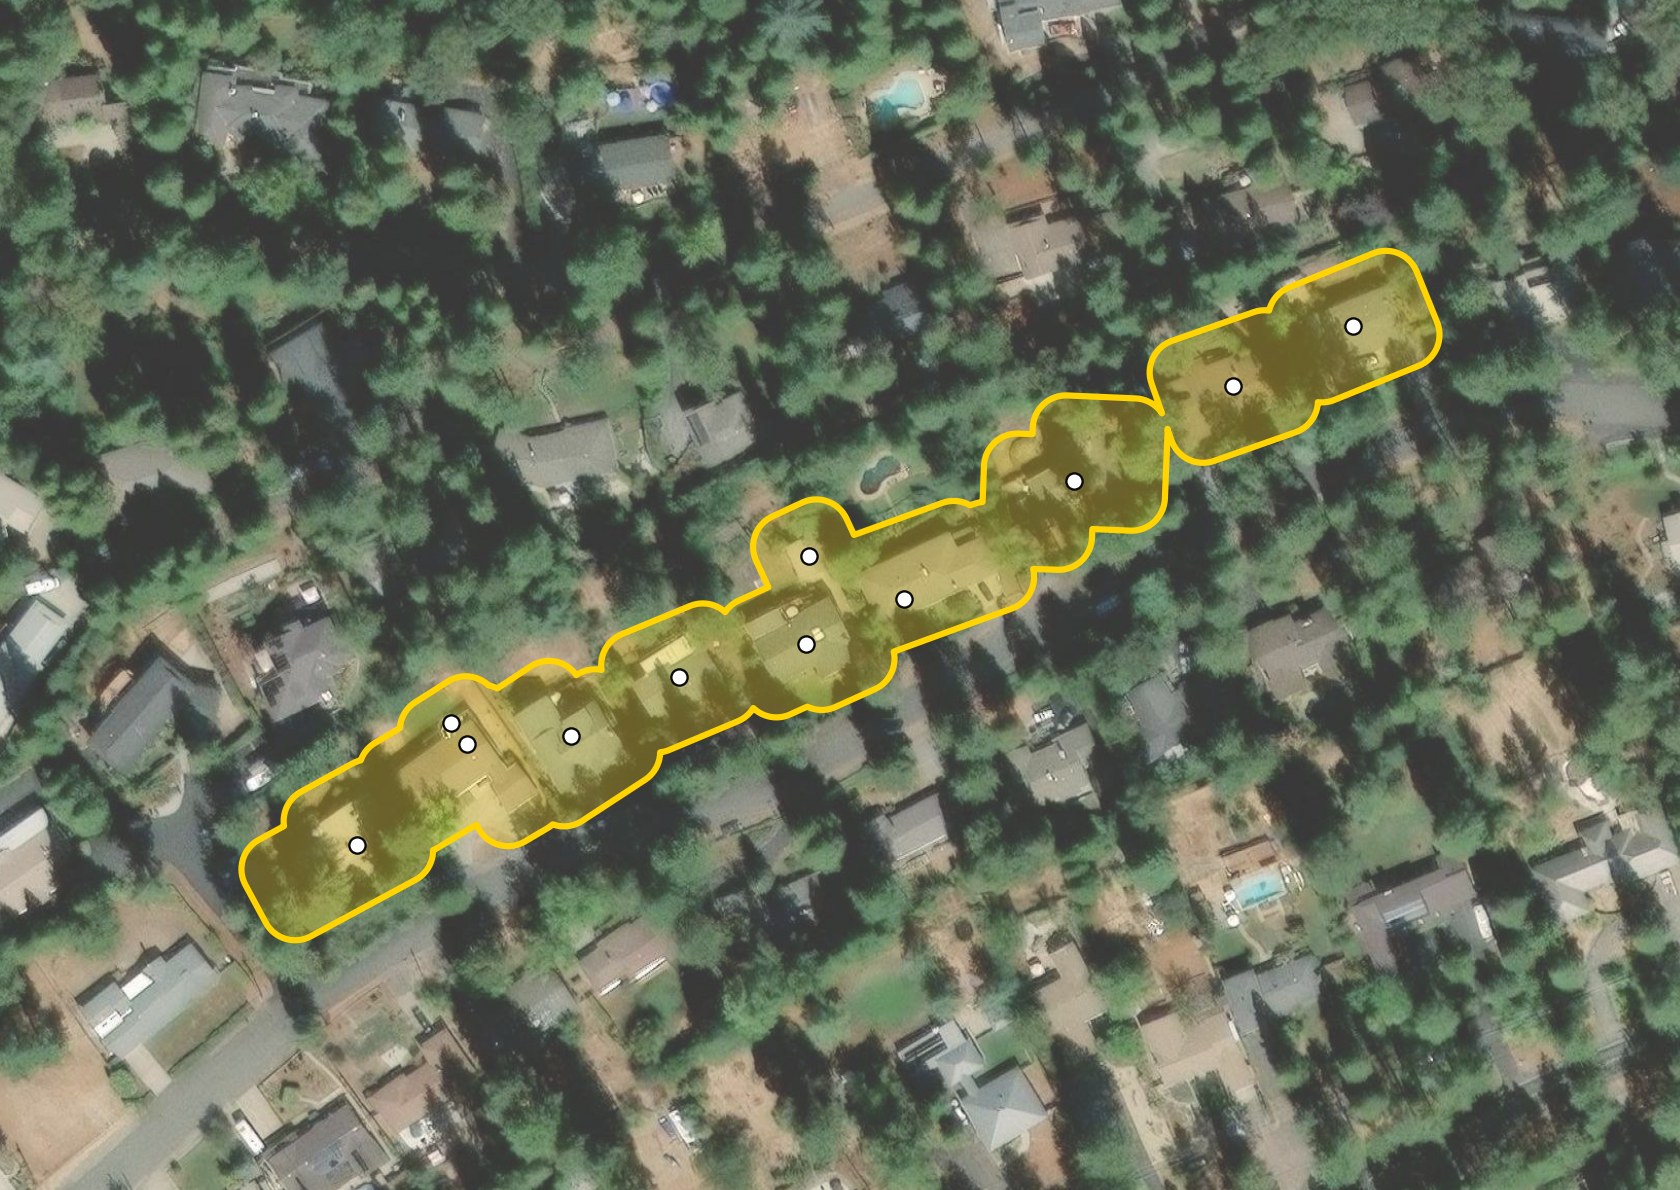
Illustration of a single conflagration block
One Conflagration Block
Esri, Maxar, Earthstar Geographics, USDA FSA, USGS, Aerial Express, GeoEye, Getmapping, Aerogrid, IGN, IGP, swisstopo, and the GIS User Community
Conflagration blocks

Conflagration blocks are groups of structures with less than 50 feet of separation. Conflagration blocks carry conflagration risk.

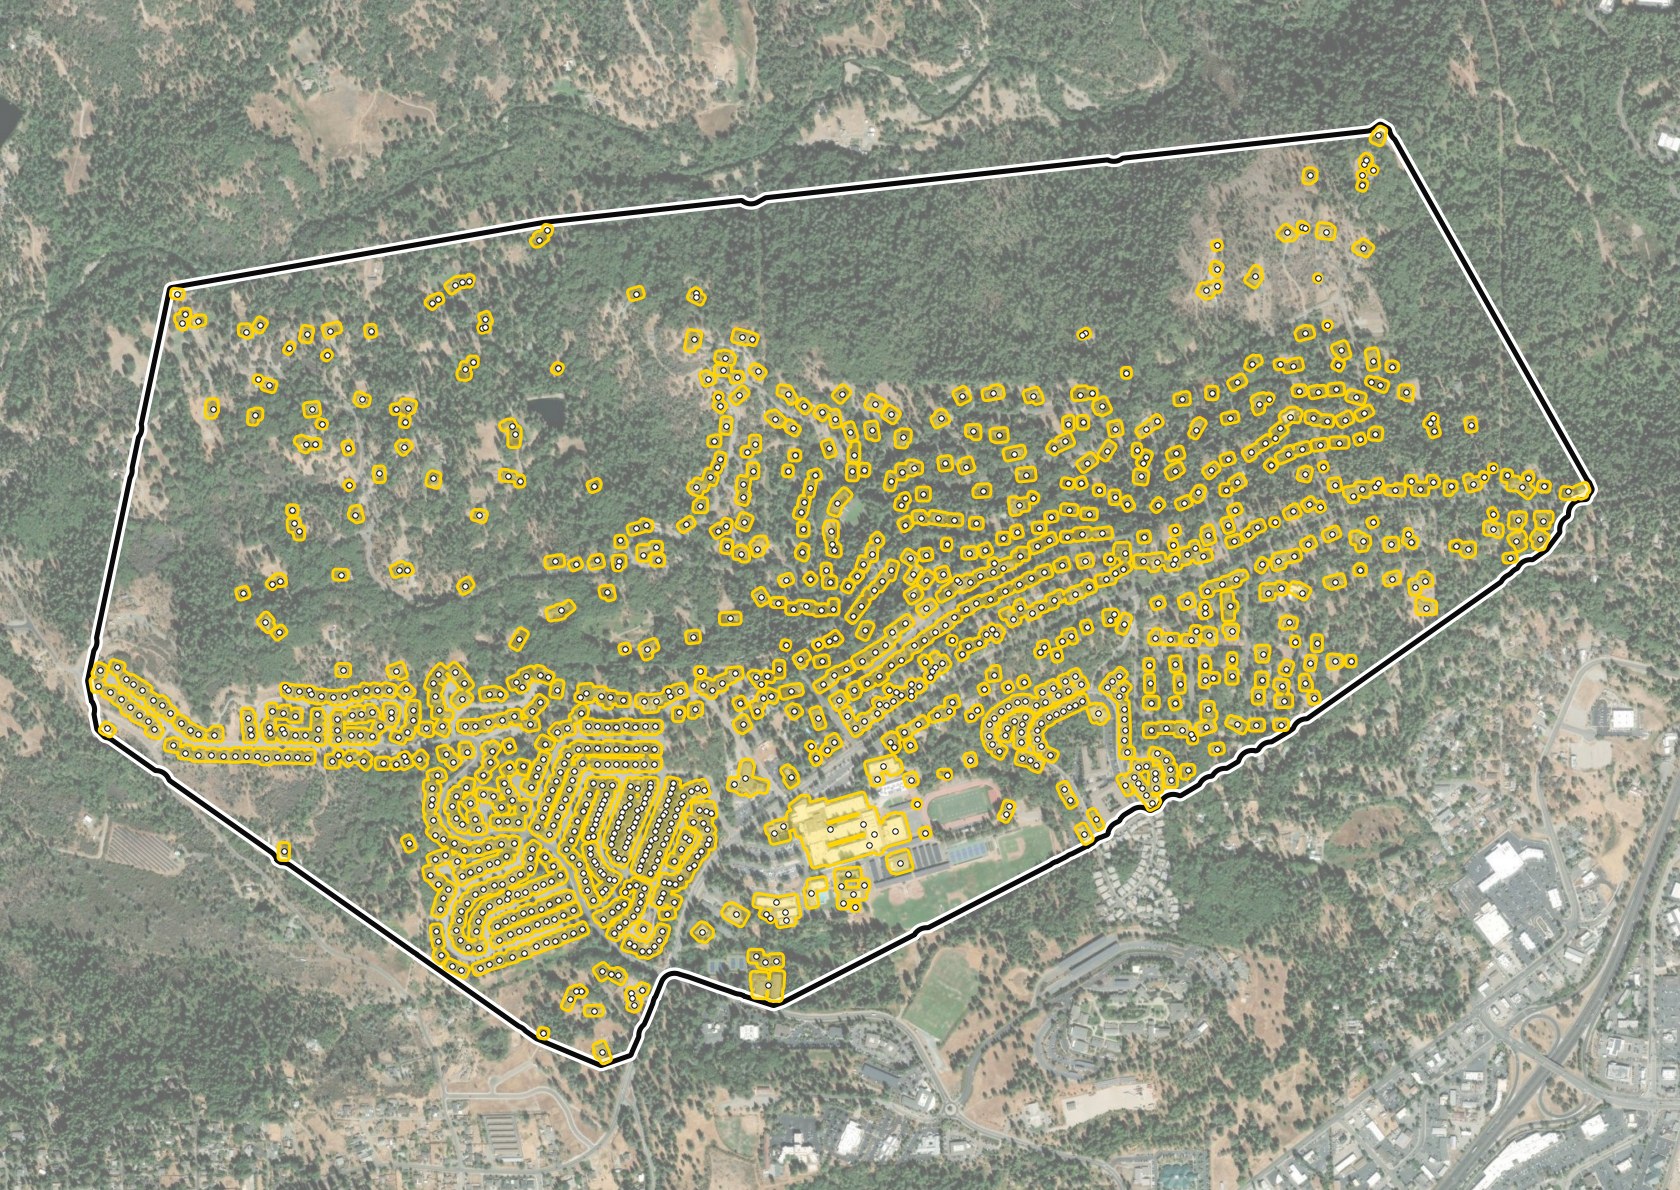
Illustration of a work unit and the conflagration blocks inside it
One Work Unit
Esri, Maxar, Earthstar Geographics, USDA FSA, USGS, Aerial Express, GeoEye, Getmapping, Aerogrid, IGN, IGP, swisstopo, and the GIS User Community
Work units

Work units are a spatial planning framework bounded by non-burnable features. The structures inside a work unit share related fire risk. Work units are the planning unit for mitigation, and they can be further divided into subunits.

Return on Investment

Rank treatments and mitigation units.

We prioritize work units and treatments by return on investment.

What ROI is

Return on investment (ROI) is how much wildfire loss a mitigation action avoids for every dollar it costs.

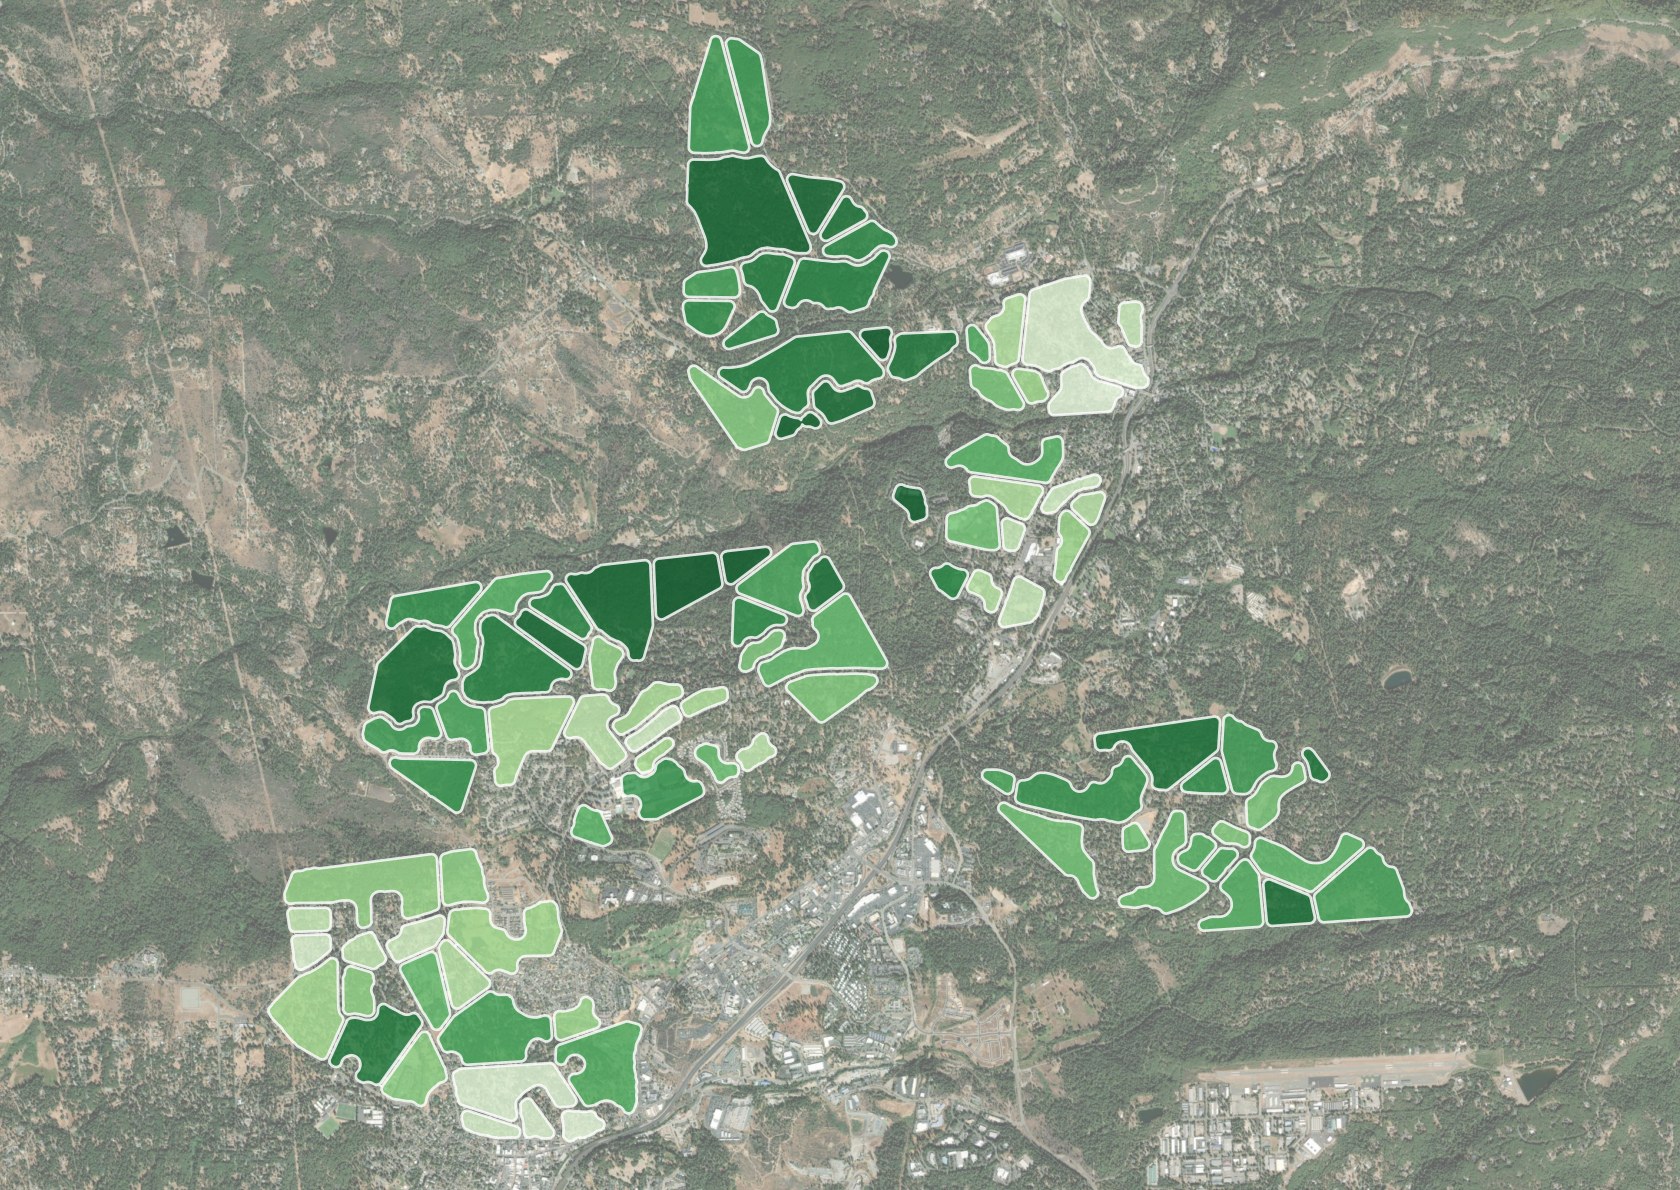
Work units shaded from low to high return on investment
Example Work Units by ROI
Esri, Maxar, Earthstar Geographics, USDA FSA, USGS, Aerial Express, GeoEye, Getmapping, Aerogrid, IGN, IGP, swisstopo, and the GIS User Community
Return on investment
LowHigh
Work unit
How we prioritize
1Score each unitBy community loss potential.
2Compare it with costOf mitigation: vegetation treatment and home hardening.
3Rank by ROIThe highest returns come first.
4Pick a high-return unitWhere there is the will to act.
Use Cases

How communities operationalize this data.

This analysis supports planning, outreach, funding and development review.

1Risk-Prioritized Ember Resistance and Vegetation Management Projects
2Community Education and Outreach
3Mitigation Scenario Modeling for Fire Weather Events (High Ignition Locations)
4CWPP Prioritization and Grant Applications
5Wildfire Risk Assessments for Proposed Developments

Learn what XyloPlan can do for you.

This assessment was prepared for Grass Valley and Nevada City as a preview of XyloPlan’s offerings. If you are interested in a custom platform to understand fire risk in your area, book a demo of the XyloPlan platform.

Book a demo